Table of Contents
Did you know that using Gantt charts can increase project completion rates by up to 20%? If you’re looking to streamline your project management process, creating a Gantt chart in Smartsheet could be the game-changer you need. With its user-friendly interface and powerful features, Smartsheet offers a seamless way to visualize timelines, track progress, and manage tasks effectively.
Whether you’re a seasoned project manager or new to the field, mastering the art of creating Gantt charts in Smartsheet can take your productivity to new heights. In this post, we’ll guide you through the step-by-step process of creating dynamic Gantt charts that will help you stay organized and on track with your projects. Get ready to revolutionize your workflow with this essential tool.
Key Takeaways
- Utilize Gantt charts for project management: Gantt charts are valuable tools for visualizing project timelines and dependencies, aiding in better planning and tracking.
- Customize your Gantt chart: Tailor your chart in Smartsheet to improve visibility by adjusting colors, fonts, and layout according to your project needs.
- Stay updated with real-time data: Incorporate live data into your Gantt chart to ensure accurate tracking and decision-making throughout the project lifecycle.
- Manage tasks effectively: Use Smartsheet’s features to enter dates, set dependencies, and organize tasks within your Gantt chart for efficient project management.
- Create Gantt chart dashboards: Enhance project visibility by creating dashboards that provide a comprehensive overview of multiple Gantt charts, facilitating better monitoring and decision-making.
- Regularly review and update your Gantt chart: Ensure that your Gantt chart remains up-to-date by regularly reviewing and modifying it as the project progresses.
Understanding the Basics of Gantt Charts
Creating a Gantt Chart in Smartsheet
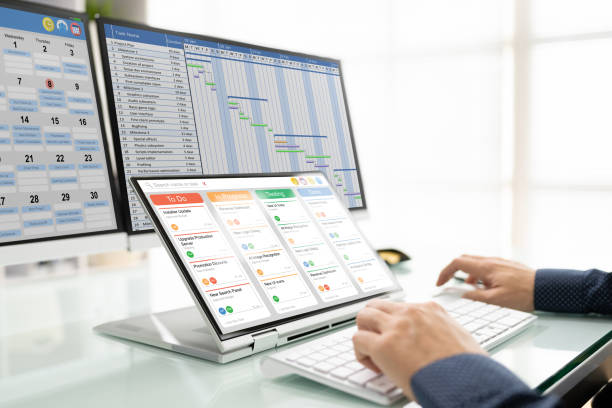
To create a Gantt chart in Smartsheet, start by opening the software and selecting “Grid View.” Then, list your project tasks in one column and their respective start and end dates in separate columns. Next, highlight the task names and dates before clicking on “Gantt View” to automatically generate your chart.
Smartsheet allows you to easily adjust task durations, dependencies, and milestones directly within the Gantt chart. By dragging tasks on the timeline or linking them with arrows to show dependencies, you can efficiently manage your project’s schedule.
Customizing Your Gantt Chart
In Smartsheet, you can customize your Gantt chart by adding different colors for various task categories or team members. This visual distinction helps stakeholders quickly identify critical tasks or responsibilities at a glance.
Moreover, utilizing filters enables you to focus on specific aspects of your project within the Gantt chart. For example, filtering by deadlines can help prioritize time-sensitive tasks while hiding completed activities streamlines focus on ongoing work.
Collaborating and Sharing
One significant advantage of using Smartsheet for creating Gantt charts is its collaborative features. Team members can access and update the chart simultaneously from anywhere with an internet connection. This real-time collaboration ensures everyone stays informed about project progress without delays.
Sharing options allow you to distribute your Gantt chart securely with stakeholders who may not have direct access to Smartsheet accounts. You can choose whether viewers have editing capabilities or are limited to viewing only for better control over data integrity.
Significance of Using Gantt Charts for Projects
Using Smartsheet for Gantt Charts
Creating a Gantt chart in Smartsheet is straightforward and efficient. Begin by logging into your Smartsheet account and selecting the “+” icon to create a new sheet. Choose “Gantt Chart” from the template options or convert an existing sheet into a Gantt view. Input project tasks, start dates, durations, dependencies, and assignees easily within the interface.
Smartsheet’s user-friendly platform allows for simple drag-and-drop functionality to adjust task timelines quickly. Customize your Gantt chart with different colors for various task categories or team members. Utilize filters to focus on specific aspects of your project timeline effortlessly. With real-time collaboration features, team members can update progress instantly, ensuring everyone stays informed and aligned on project developments.
Benefits of Using Gantt Charts in Projects
- Clear Visualization: Creating a Gantt chart in Smartsheet offers a visual representation of project timelines and milestones.
- Identifying Critical Path Activities: By using this tool effectively, you can pinpoint crucial tasks that directly impact project completion.
- Spotting Bottlenecks: Visualizing task dependencies helps identify potential bottlenecks early on so they can be addressed promptly.
- Enhanced Communication: Team members benefit from improved communication through shared access to the same up-to-date information.
When creating your Gantt chart in Smartsheet, remember that its dynamic nature allows for easy adjustments as projects evolve. Take advantage of automated features like notifications and reminders to keep track of deadlines efficiently.
Setting Up Your First Gantt Chart in Smartsheet
Creating a New Sheet
To start creating a Gantt chart in Smartsheet, begin by opening the tool and creating a new sheet. Look for the option to start from scratch or choose a template. Opt for the Gantt chart template provided by Smartsheet to kick off your project.
When you select the Gantt chart template, you’ll notice that it automatically sets up your sheet with all the necessary columns and formatting suitable for a Gantt chart. This feature simplifies the initial setup process so that you can focus on customizing your chart further.
Customizing Your Gantt Chart
After selecting the Gantt chart template, it’s time to customize it according to your project needs. You can add different columns such as start date, end date, duration, % complete, and more depending on what information you want to track within your Gantt chart.
To make your Gantt chart visually appealing and easy to understand at first glance, consider adding labels and color-coding tasks based on their status or priority level. Utilize formatting options available in Smartsheet like bold text, highlighting cells, or changing font colors to emphasize important information.
Remember that each task should be represented as a row in your Gant chart, while grouping related tasks under parent rows can help organize complex projects effectively.
Entering Dates and Managing Dependencies
Establishing Project Timeline
To create a Gantt chart in Smartsheet, it’s crucial to input task start and end dates accurately. These dates form the foundation of your project timeline. By defining these dates, you establish when each task should begin and end.
When using Smartsheet to build your Gantt chart, ensure that you fill in the date columns with the appropriate start date and finish date for each task. This action helps visualize the project’s schedule clearly.
Defining Task Relationships
In Smartsheet, dependencies play a vital role in establishing relationships between tasks on your Gantt chart. By linking tasks through dependencies, you can indicate which tasks must be completed before others can start. For instance, if Task A needs to finish before Task B can commence, you would set up a dependency indicating that Task B follows Task A.
To manage dependencies effectively, use the “Predecessors” column in Smartsheet to specify which task comes before another. This feature allows you to create a logical sequence of activities within your project.
Optimizing Scheduling
Adjusting task durations or dependencies is essential for optimizing scheduling within your Gantt chart on Smartsheet. If there are changes in deadlines or delays occur during the project execution phase, modifying task lengths or rearranging dependencies can help keep your schedule on track.
By selecting specific tasks and adjusting their duration or updating their relationships with other tasks as needed, you can ensure that your project stays aligned with its intended timeline.
- Pros:
- Clear visualization of project timelines.
- Easy identification of task relationships.
- Cons:
- Time-consuming if frequent adjustments are required.
- Complexity may increase with larger projects.
Customizing Your Gantt Chart for Better Visibility
Color Coding
Color coding in Gantt chart helps distinguish between various task types or priorities. For instance, you can assign different colors to tasks based on their importance or status. This visual distinction makes it easier to identify critical tasks at a glance.
Using color coding allows you to quickly see which tasks are urgent, upcoming, or completed. By assigning specific colors to each category, such as red for overdue tasks and green for completed ones, you can efficiently manage your project timeline.
Conditional Formatting
Conditional formatting is a powerful tool that enables you to highlight overdue or upcoming tasks in your Gantt chart. By setting up rules within Smartsheet, you can automatically flag tasks that are behind schedule or nearing their deadlines.
With conditional formatting, you can draw attention to critical milestones by applying bold fonts, changing text colors, or adding icons next to important dates. This feature ensures that no crucial deadlines are missed and keeps your project on track.
Zoom Levels and Filter Options
Adjusting zoom levels and utilizing filter options are essential for better visualization of your project in Smartsheet’s Gantt chart. Zooming in allows you to focus on specific details within the timeline, while zooming out provides an overview of the entire project duration.
Managing Project Tasks within Your Gantt Chart
Adding and Modifying Tasks
You can easily add, delete, or modify tasks directly on your Gantt chart in Smartsheet. This feature allows you to make real-time adjustments to your project plan without navigating through multiple menus. By simply interacting with the task bars, you can ensure that your project’s timeline is up-to-date.
When a new task needs to be added, click on an empty area of the chart and input the task details. To delete a task, select it and press the delete key or right-click for more options. Modifying tasks involves adjusting their duration, dependencies, or assigned team members by clicking on individual task bars.
Assigning Team Members
Assigning team members to specific tasks is crucial for accountability and effective collaboration within a project. In Smartsheet’s Gantt chart view, you can easily designate responsible individuals by associating them with each task bar. This ensures that everyone knows their role in the project and who to reach out to for updates or clarifications.
To assign a team member, click on the desired task bar and access the properties panel where you can assign individuals from your team. By clearly defining responsibilities within the Gantt chart itself, you streamline communication channels and foster teamwork among project participants.
Tracking Task Progress
Tracking progress is essential for monitoring timelines and ensuring that projects stay on schedule. In Smartsheet’s Gantt chart view, updating completion percentages or status indicators provides quick insights into how each task is progressing towards its finish date. This visual representation helps stakeholders grasp overall progress at a glance.
Incorporating Real-Time Data into Your Gantt Chart
Integrate Data
To create a Gantt chart in Smartsheet, you can integrate data from various systems or applications. This allows you to consolidate information from different sources, providing a comprehensive view of your project. For instance, you can link your chart to Google Sheets or Microsoft Excel to pull in relevant data automatically.
By incorporating external data sources, you ensure that your Gantt chart is always up-to-date with the latest information. This integration streamlines the process and minimizes manual input errors, enhancing the accuracy and efficiency of your project management.
Automate Calculations
Utilize formulas or functions within Smartsheet to automate calculations directly within your Gantt chart. By setting up formulas for task durations, dependencies, or resource allocation, you can save time on manual computations and reduce the risk of human error.
Automating calculations not only speeds up the planning process but also ensures consistency across all tasks and timelines in your Gantt chart. This feature enables you to make quick adjustments while maintaining accurate project schedules effortlessly.
Enhancing Project Visibility with Gantt Chart Dashboards
Project Dashboards for Overview
Project dashboards in Smartsheet offer a comprehensive view of multiple Gantt charts. These dashboards serve as centralized hubs, providing stakeholders with an overarching perspective on various projects simultaneously. By incorporating different Gantt charts into one dashboard, users can easily compare timelines, identify dependencies, and track progress across multiple initiatives.
Creating project dashboards enhances collaboration among team members by offering a shared space where everyone can access critical project information. With all essential data consolidated in one location, teams can work cohesively towards common goals without the need to switch between different sheets or documents constantly. This streamlined approach fosters efficiency and transparency within the project management process.
Utilizing Widgets for Visualization
Widgets play a crucial role in displaying key project metrics and milestones within Gantt chart dashboards on Smartsheet. These visual representations provide at-a-glance insights into project progress, highlighting important dates, deadlines, and accomplishments. By customizing widgets to showcase specific components of each Gantt chart – such as task completion rates or upcoming milestones – users can quickly grasp the current status of their projects.
Incorporating visualizations like progress bars or milestone trackers not only simplifies data interpretation but also improves decision-making processes by presenting complex information in an easy-to-understand format. Stakeholders benefit from these visual aids as they gain clarity on project timelines and performance indicators at a glance.
Final Remarks
You’ve now grasped the essentials of creating and utilizing Gantt charts in Smartsheet for your projects. From setting up your first chart to customizing it for better visibility and managing tasks efficiently, you’re well on your way to enhancing your project management skills. Remember, incorporating real-time data and utilizing dashboards can take your project visibility to new heights. Keep exploring and experimenting with different features to find what works best for you. Your projects are unique, so tailor your Gantt charts accordingly. Stay curious, keep learning, and watch how your projects thrive with these newfound tools at your disposal.
Frequently Asked Questions
How can I understand the basics of Gantt Charts quickly?
Gantt charts visually represent project schedules, tasks, and timelines in a bar chart format. They help you track progress efficiently by showing task dependencies and deadlines at a glance.
Why are Gantt Charts significant for project management?
Gantt charts offer a clear overview of project timelines, task interdependencies, and milestones. They enhance communication among team members, improve planning accuracy, and facilitate effective project monitoring.
What is the process for setting up my first Gantt Chart in Smartsheet?
To create your first Gantt chart in Smartsheet:
- Open Smartsheet
- Click on “+” to create a new sheet
- Select “Gantt Chart” from the template options
- Begin adding tasks and setting durations
How do I customize my Gantt Chart in Smartsheet for better visibility?
Customize your Gantt chart by adjusting colors, fonts, labels, and time scales to suit your preferences or make specific elements stand out. Utilize features like conditional formatting to highlight critical tasks or milestones easily.
Is it possible to incorporate real-time data into my Gantt Chart on Smartsheet?
Yes! You can link cells within your Smartsheet spreadsheet to external data sources or other sheets within the platform. This allows you to automatically update information on your Gantt chart as changes occur without manual intervention.